Over the years, computer scientists are working on building models that aid the scientific community in many ways by cutting laboratory expenses or by saving time. Such models find useful applications in microscopy images as well. Determining the morphology of nanoparticles from Transmission Electron Microscopy images is a manual and cumbersome task. In the past years, scientists have tried to build models to automate the process of nanoparticle segmentation in microscopy images. This study focuses on finding the best segmentation model, which achieves high metrics and is robust to microscopy parameters. For this purpose, eight different models have been compared. The training data-set consists of 150 BF-TEM Platinum nanoparticle images containing 3629 nanoparticles of all kinds. Further, the authors examine the generalizability of the models on E-TEM Gold nanoparticle images. The authors also describe essential considerations when segmenting nanoparticle images that generalize well across the varied data-set. The layer gradients are visualised to further explain the black-box nature of neural networks.
In Search of Best Automated Model: Explaining Nanoparticle TEM Image Segmentation [Paper]
Abstract
Technologies:
- - Python
- - Pytorch
- - Captum
- - Imgaug
- - Supervisely
- - Numpy
- - Matplotlib
- - LaTeX
Models Compared
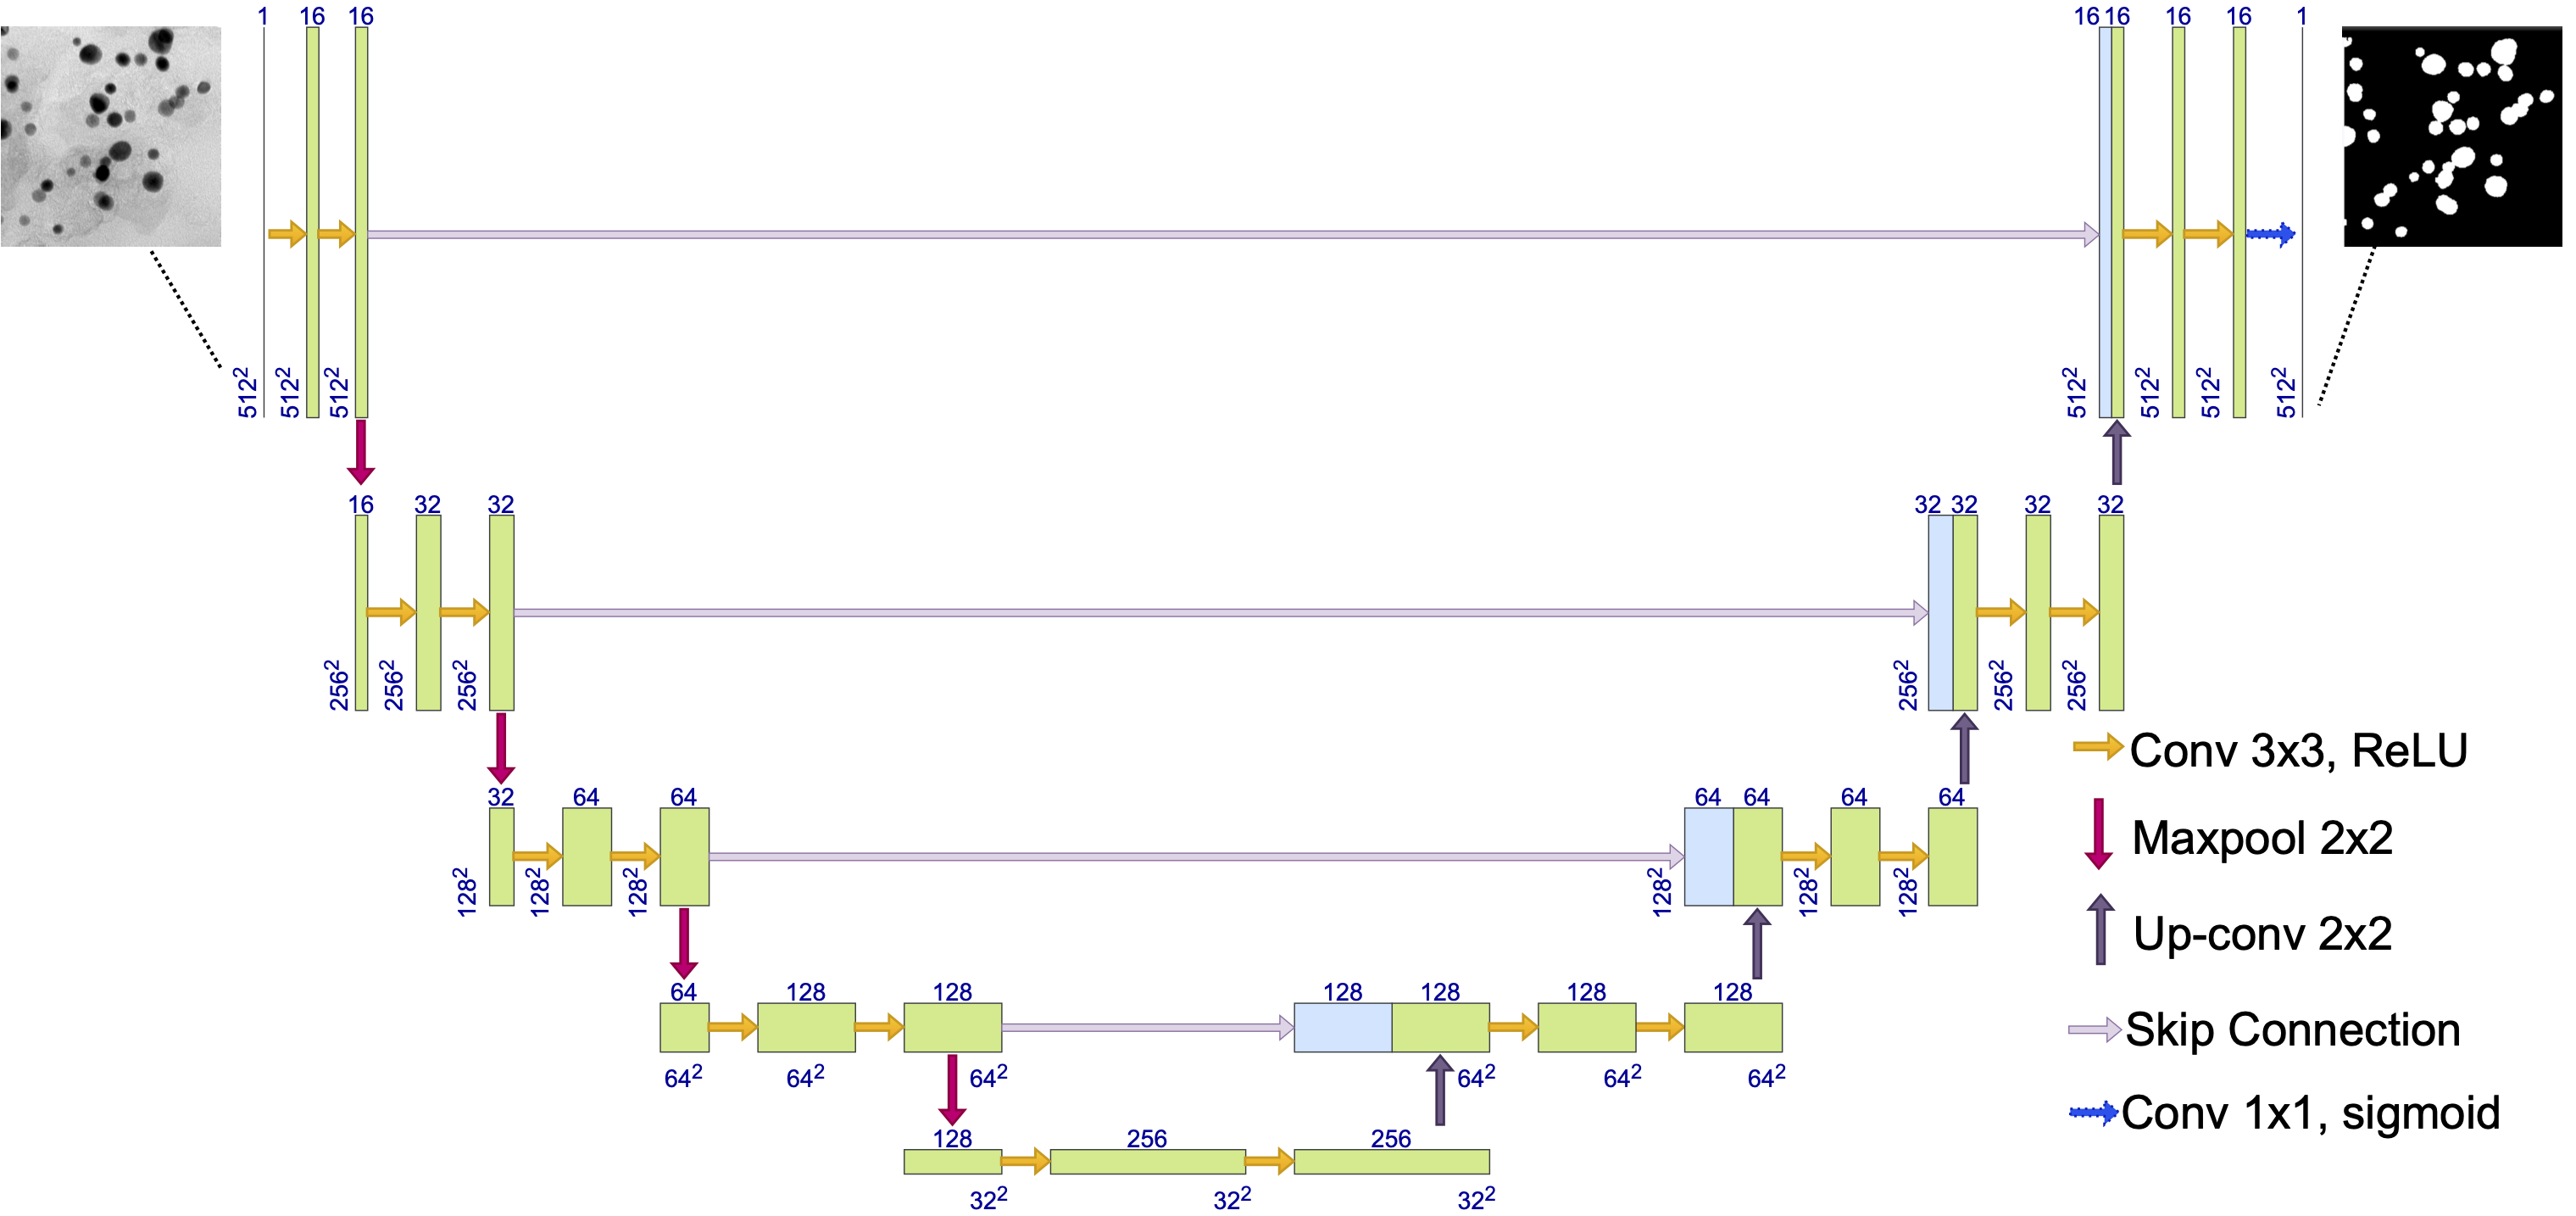
- - U-Net
- - R2U-Net
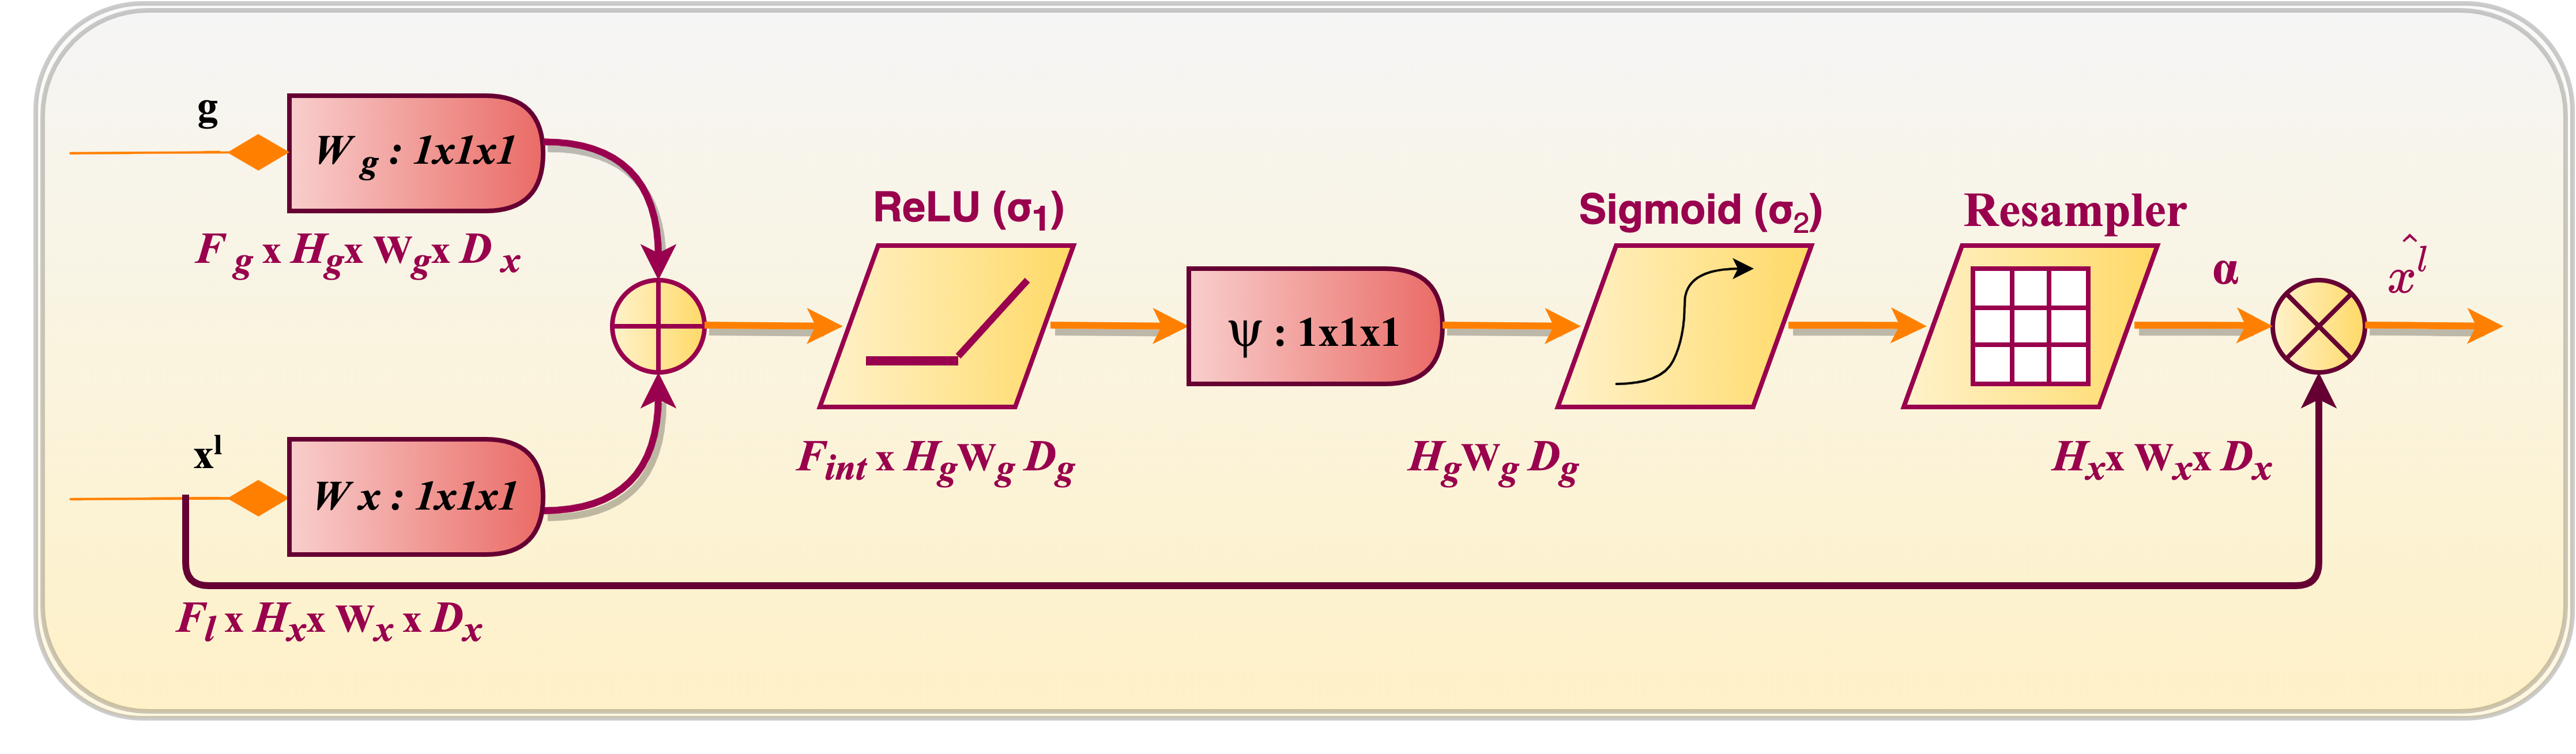
- - Attention U-Net
- - BDC U-Net
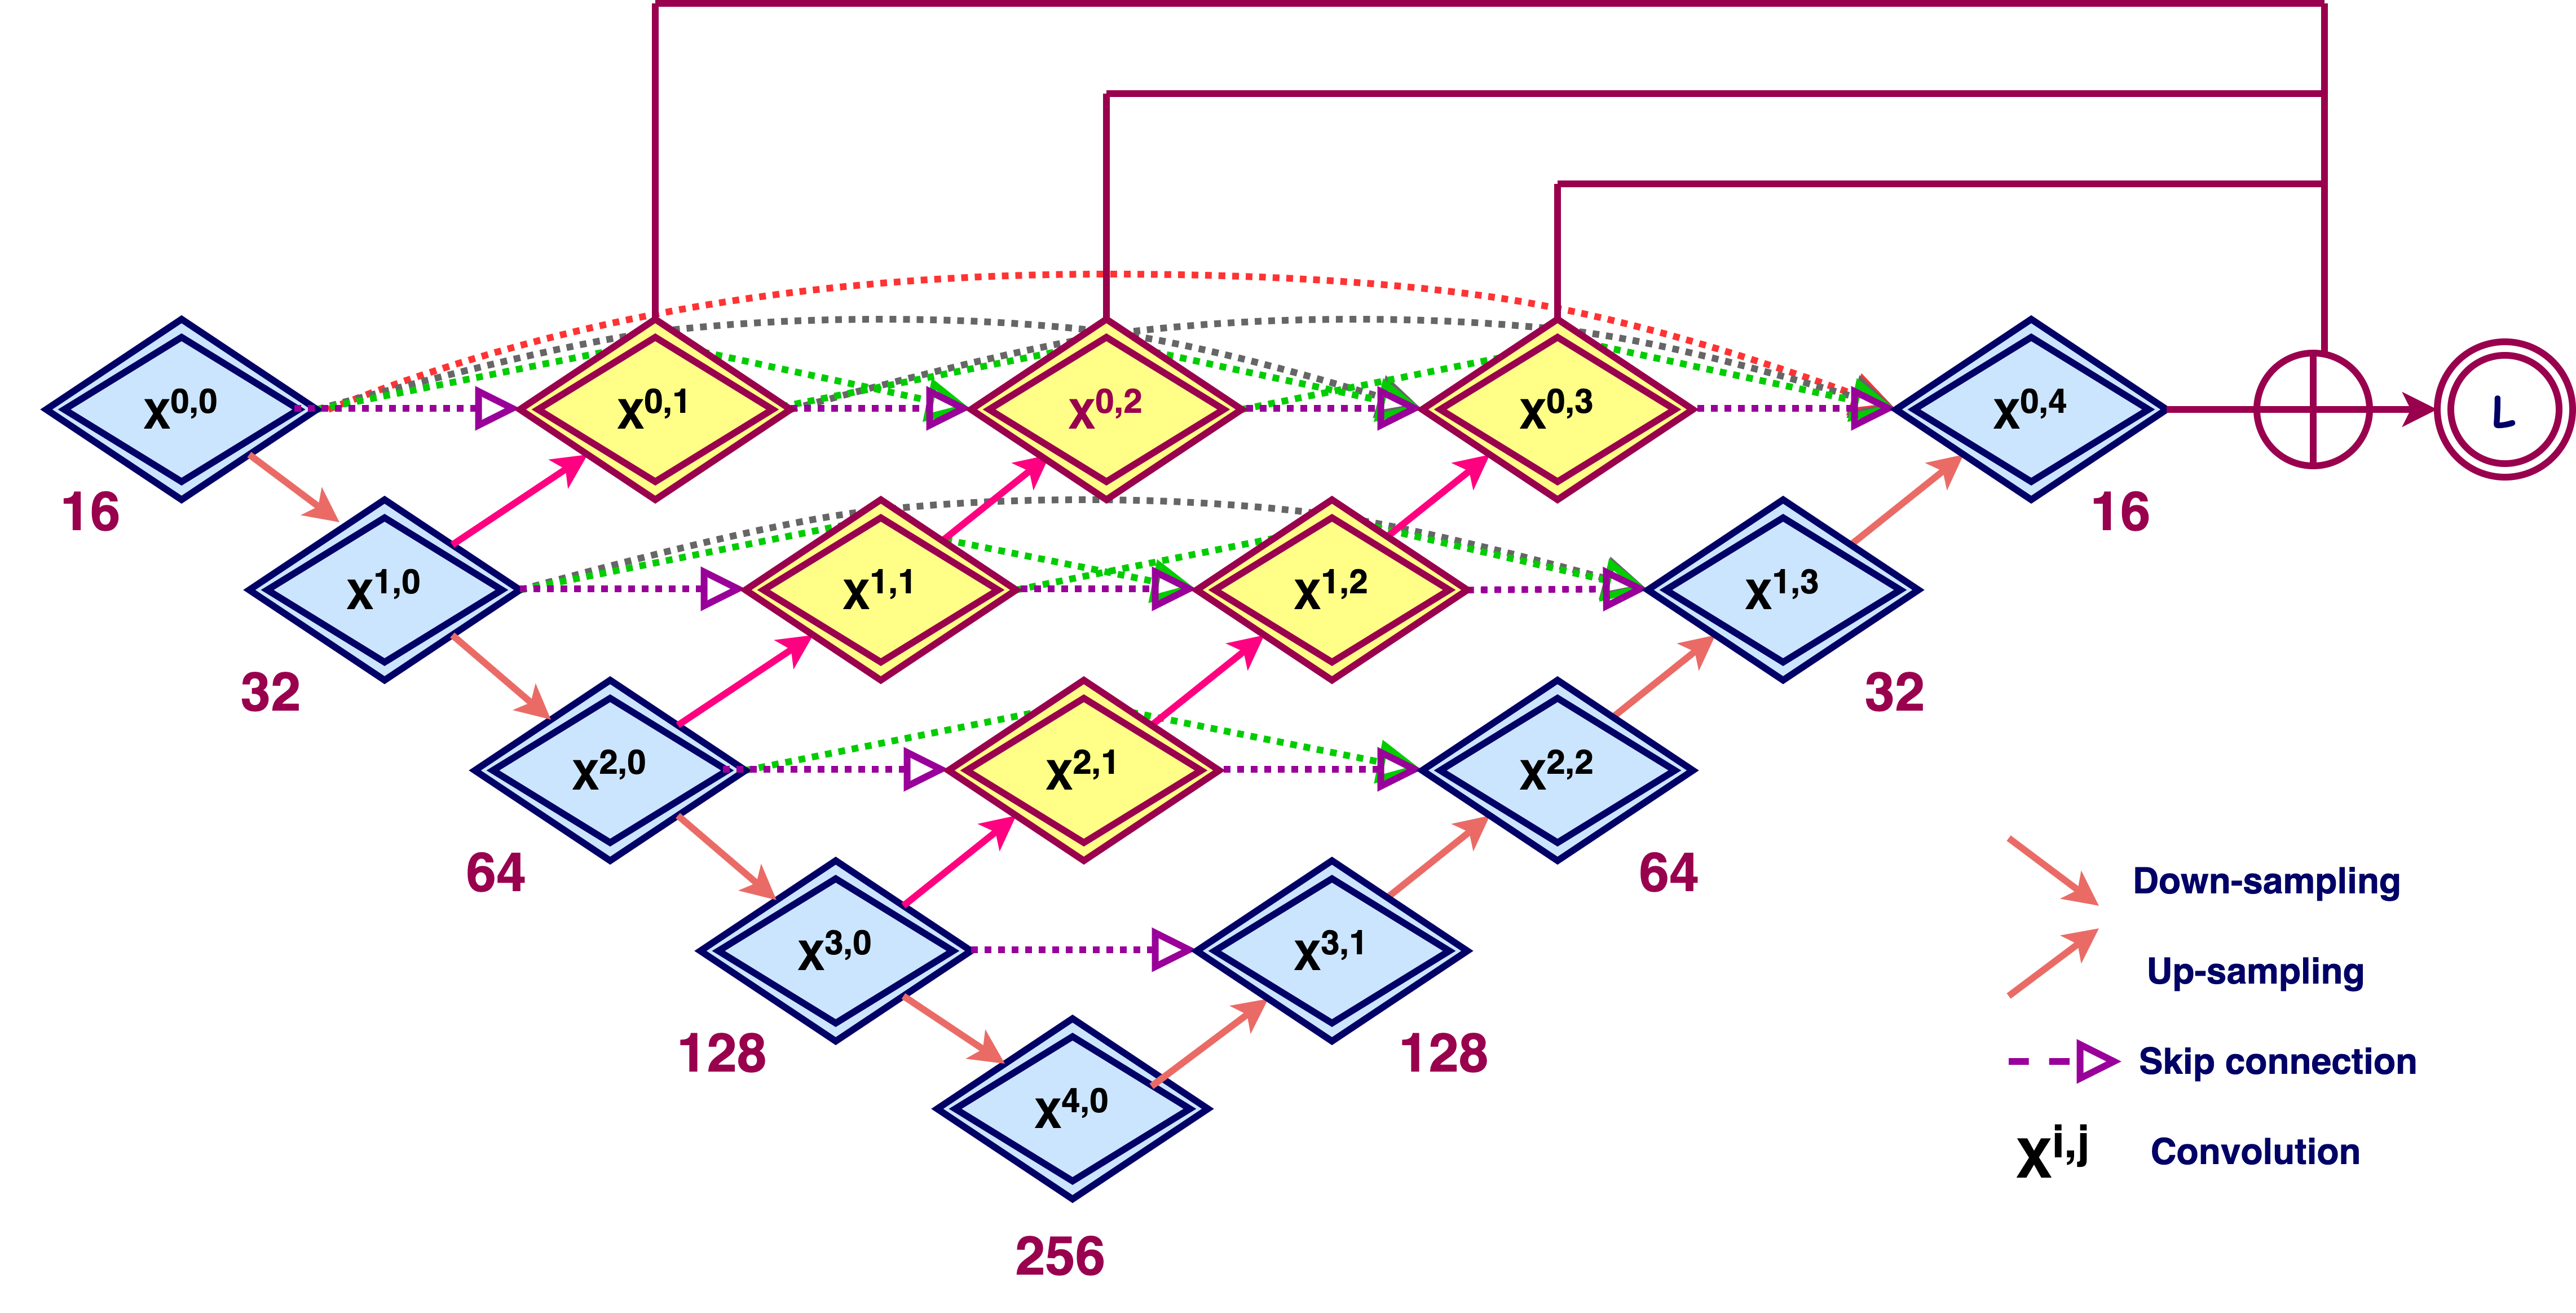
- - U-Net++
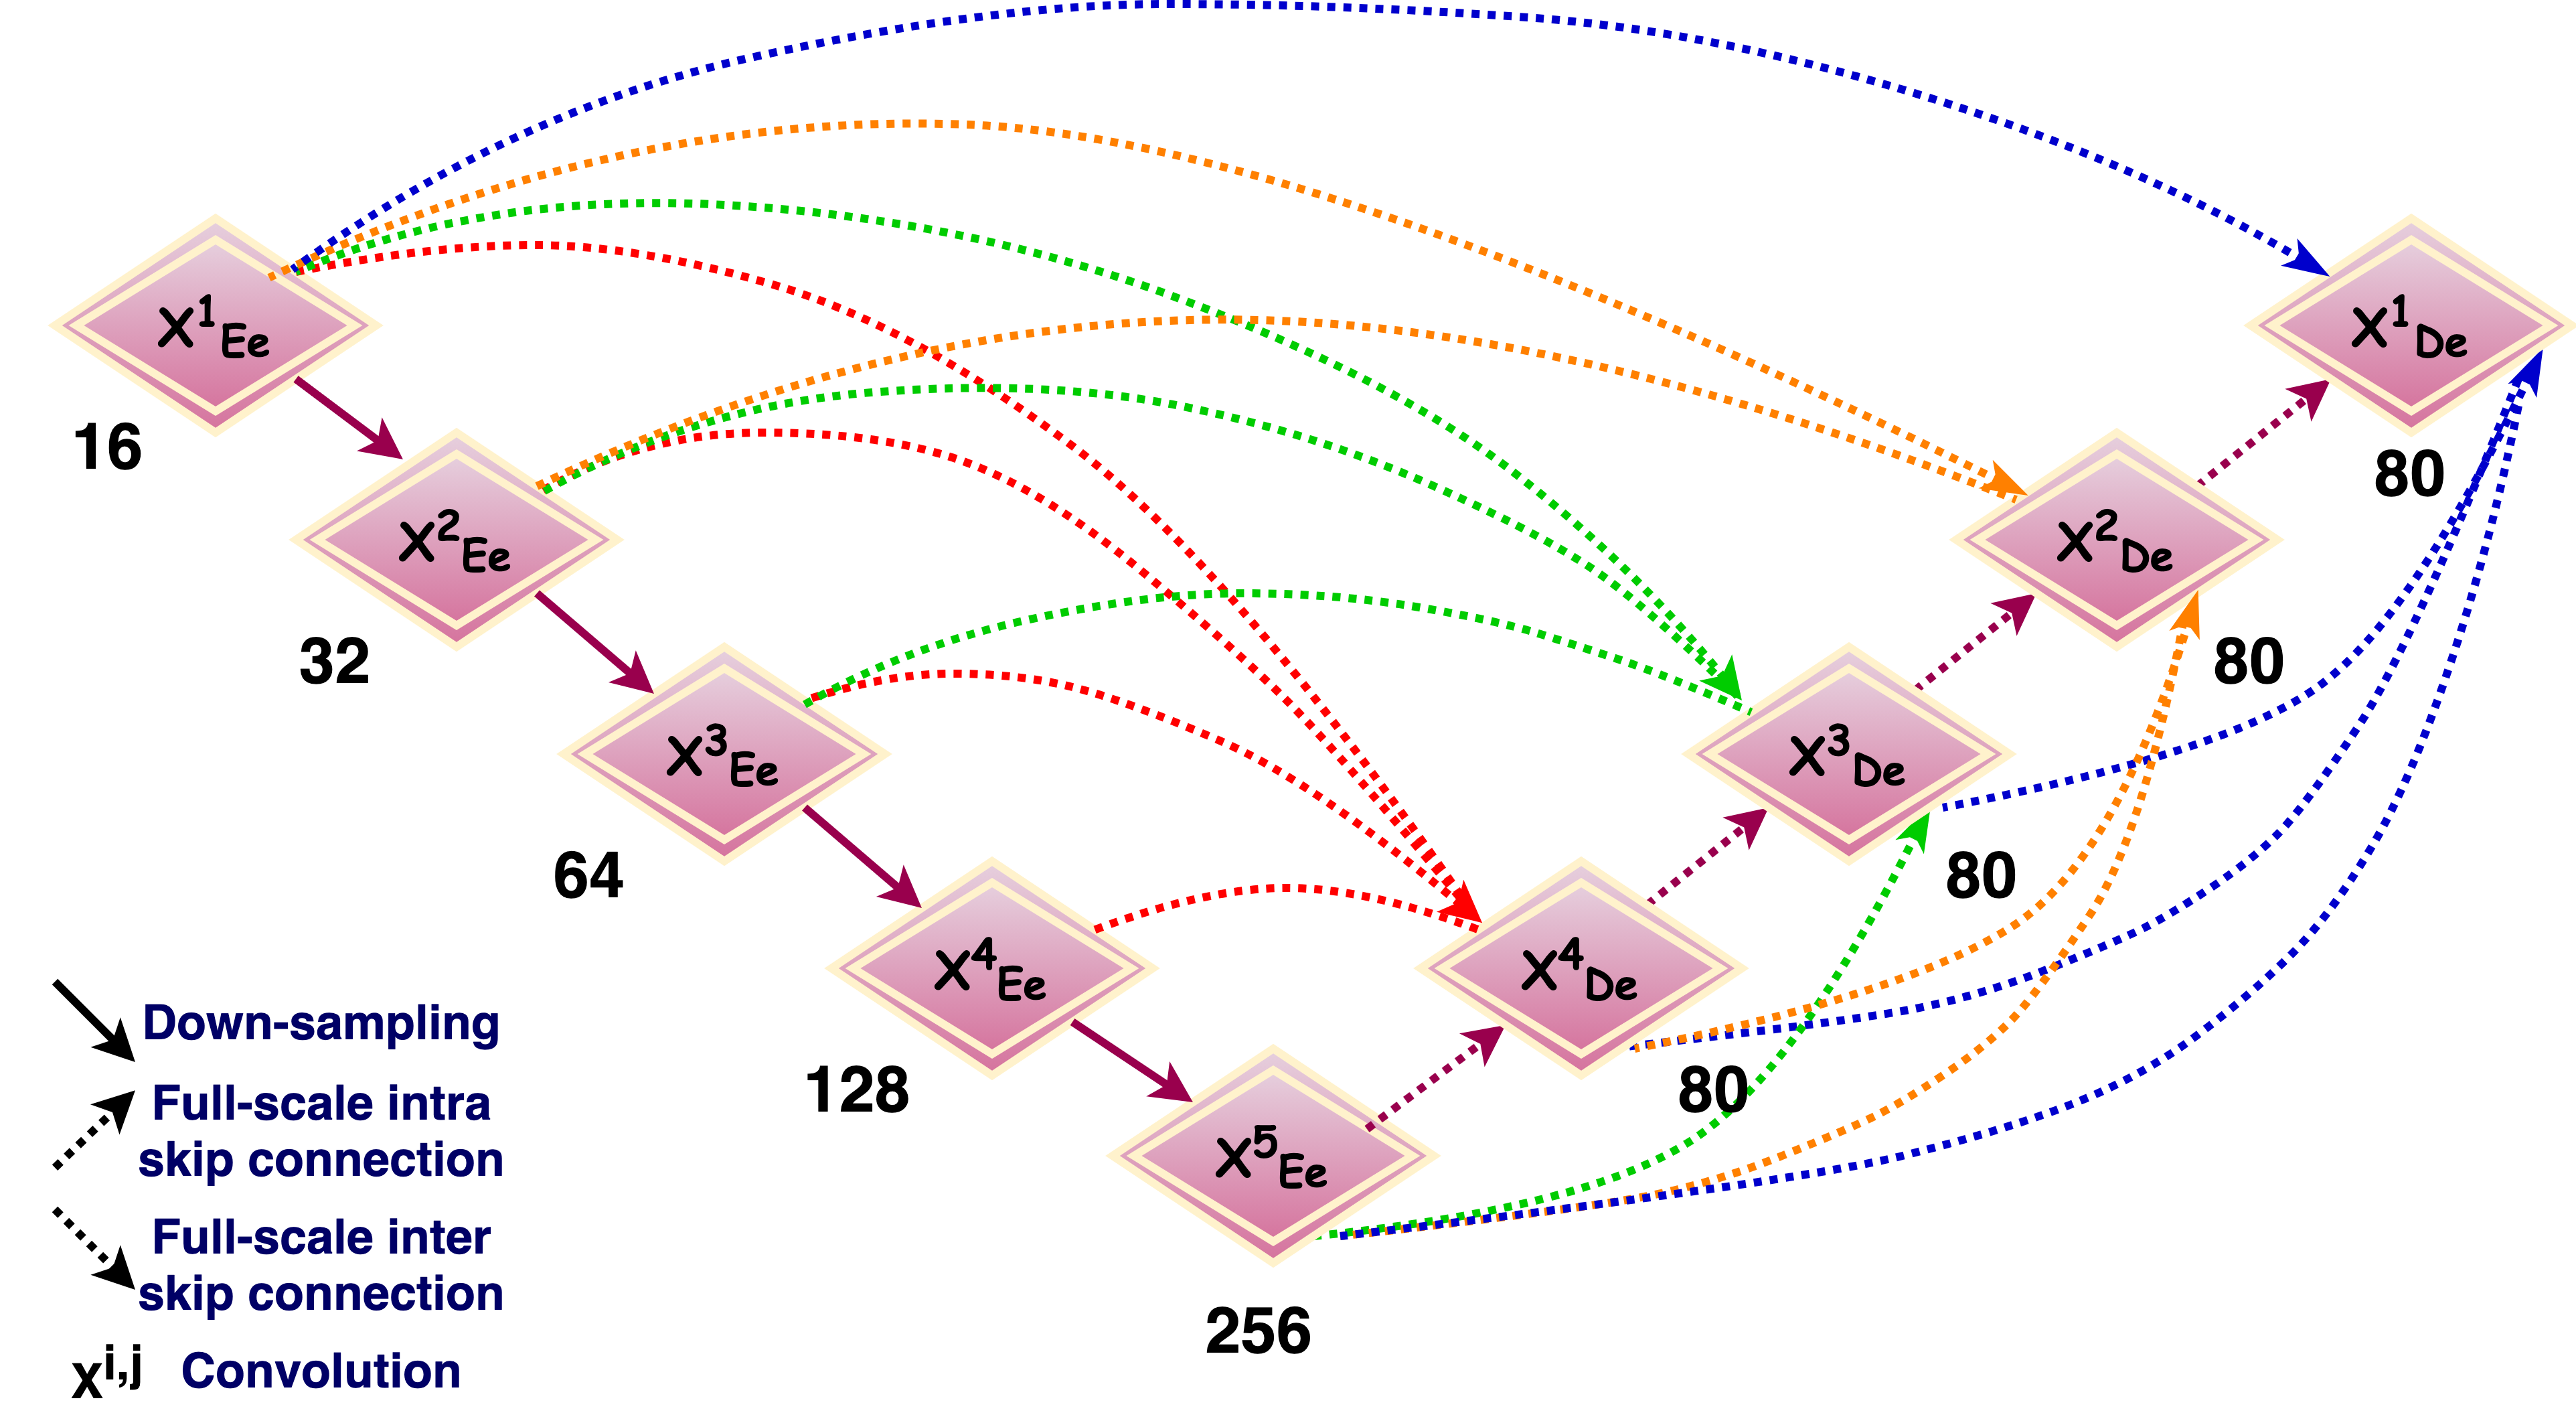
- - U-Net 3+
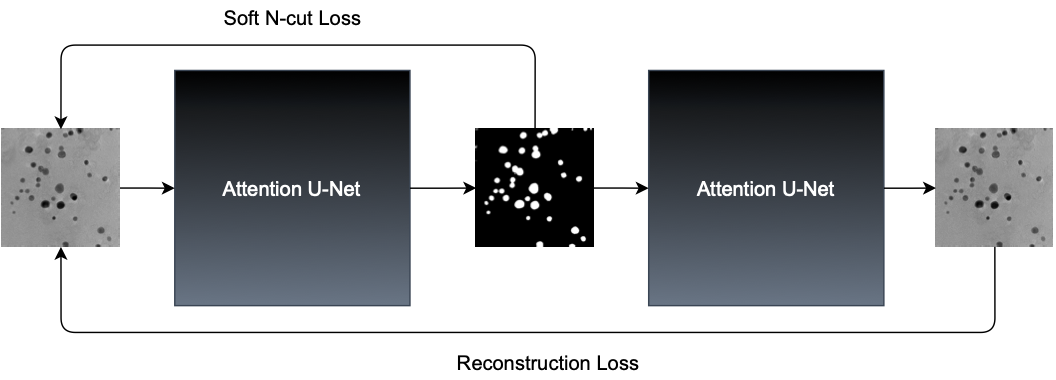
- - Attention W-Net
- - K-Means Clustering
Dataset
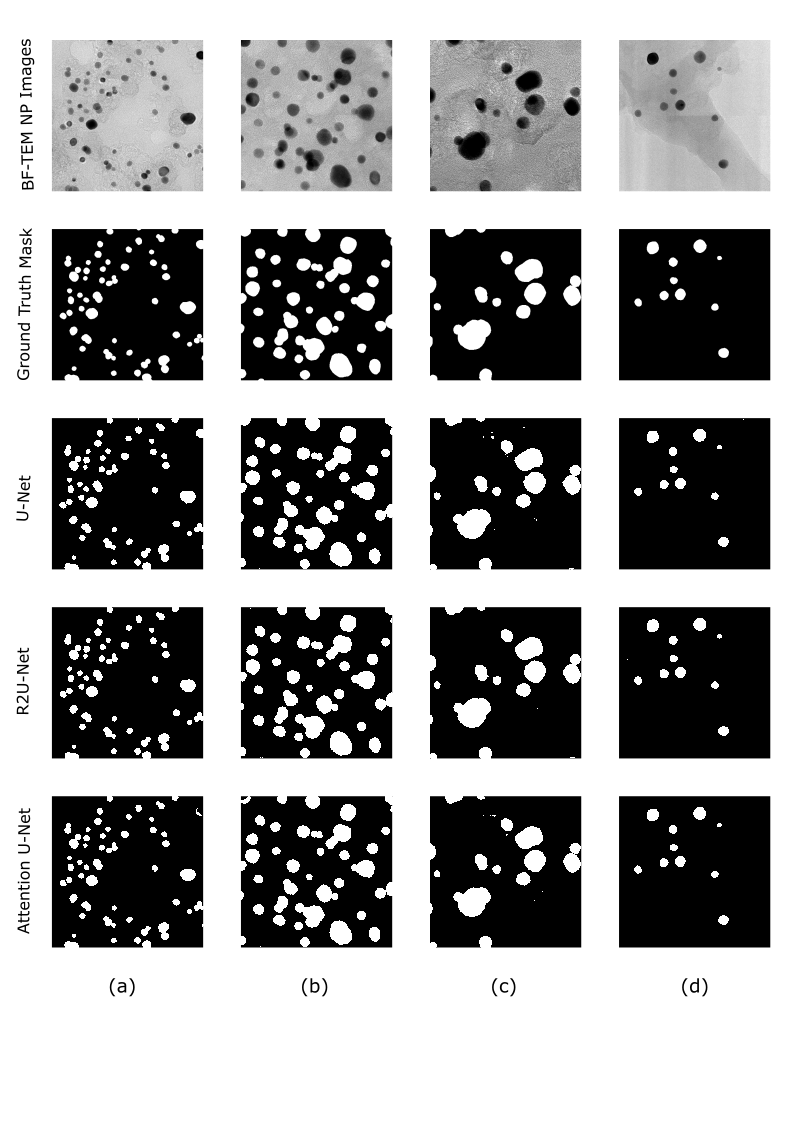
The training data comprises Bright-Field TEM (BF-TEM) images of nanocatalyst Platinum (Pt) Nanoparticles, which are obtained from the cathode of a proton exchange fuel cell captured by high-resolution JEOL 2010F TEM operated at 200kV. The 150 BF-TEM images data-set of 1024x1024 resolution was down-sampled to 512x512 and split into 105 and 45 images for training and testing, respectively. Manual annotation for generating the segmented mask of nanoparticles was done by experts using Supervisely software.
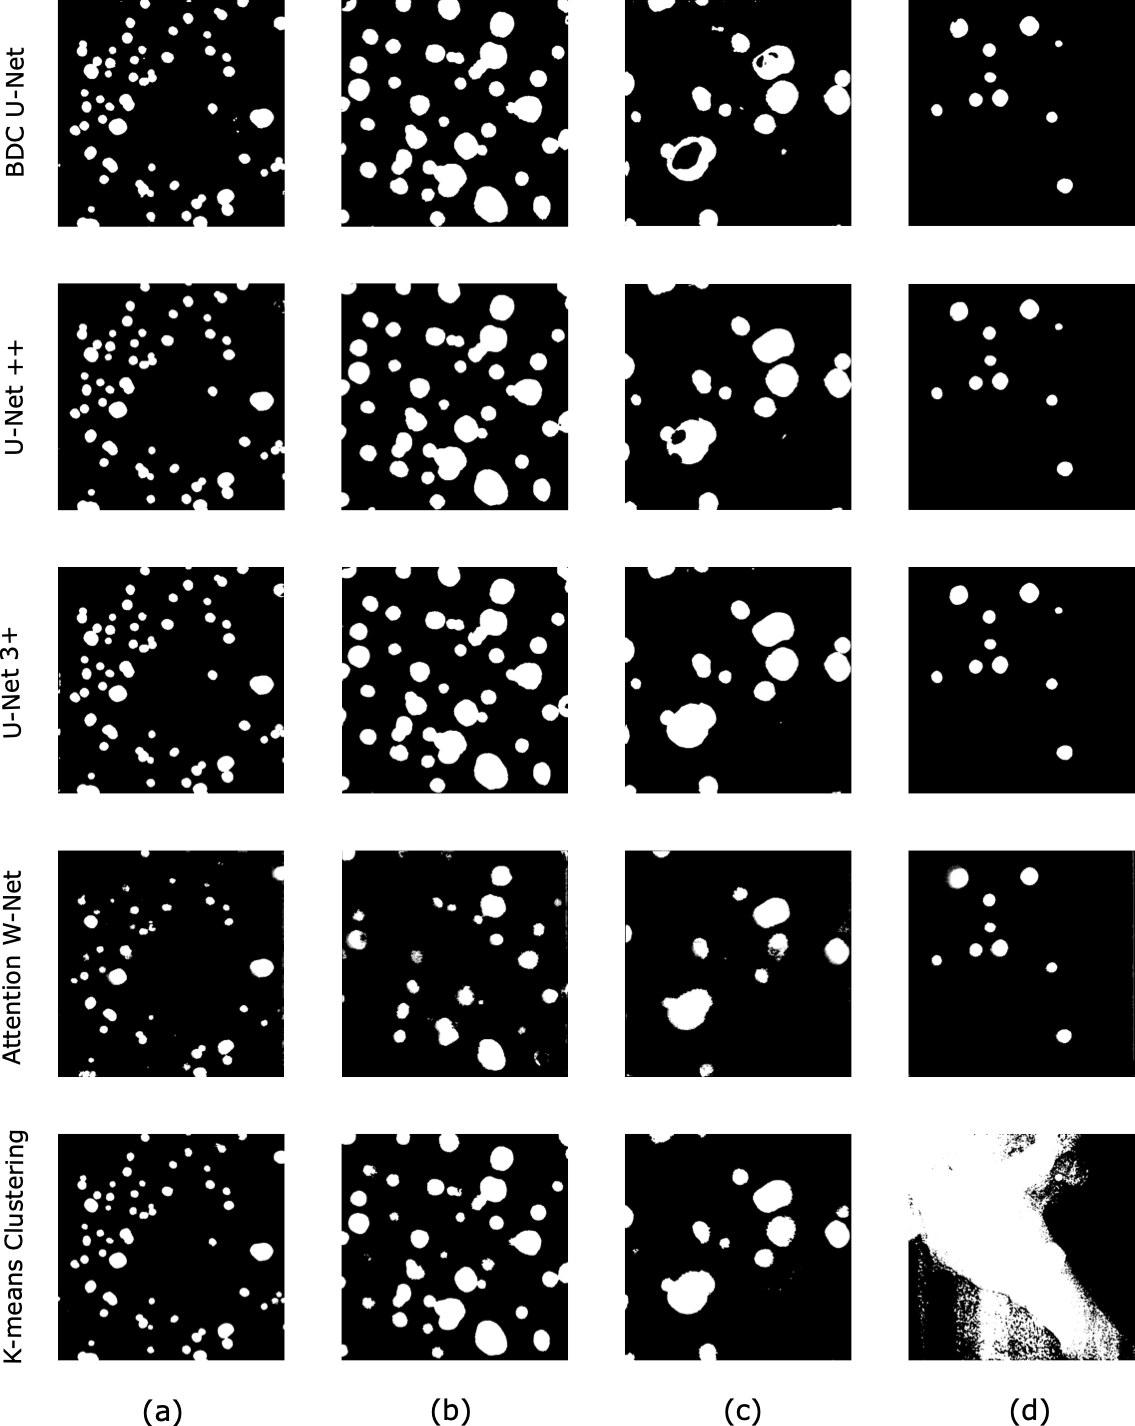
Results on BF-TEM Pt Nanoparticles
| Model | Accuracy | Precision | Recall | TPR | IoU | Dice Coefficient |
|---|---|---|---|---|---|---|
| U-Net | 99.26 | 96.65 | 96.22 | 93.11 | 92.96 | 96.43 |
| R2U-Net | 99.27 | 96.42 | 96.56 | 93.20 | 92.92 | 96.48 |
| Attention U-Net | 99.16 | 97.41 | 94.47 | 92.14 | 91.95 | 95.91 |
| BDC U-Net | 99.00 | 96.79 | 93.71 | 90.84 | 90.96 | 95.18 |
| U-Net++ | 99.24 | 97.65 | 94.94 | 92.82 | 92.86 | 96.27 |
| U-Net 3+ | 99.42 | 97.30 | 97.09 | 94.54 | 94.45 | 97.19 |
| Attention W-Net | 95.19 | 97.68 | 59.31 | 58.38 | 58.38 | 72.99 |
| K-Means Clustering | 96.95 | 87.42 | 82.65 | 73.87 | 80.66 | 84.97 |
Segmentation Images